Offcanvas

India

UK
Guides
In 2023, Google made a significant shift from Universal Analytics to Google Analytics 4 (GA4). This change introduced a new approach to tracking and analyzing user interactions. One of the key features of GA4 is the engagement rate, which is now a primary metric for SEOs to gauge user engagement.

An engagement rate measures the percentage of sessions on a single page that qualify as engaged sessions. An engaged session is characterized by any of the following:
These criteria define engaged sessions and contribute to the overall engagement rate.
In contrast, a bounce rate is the percentage of single-page sessions where users do not interact beyond that initial page. Essentially, a user visits a page and leaves without viewing any other pages on the site.
To sum up, bounce rate measures non-engaged sessions, while engagement rate measures engaged sessions. Got it?
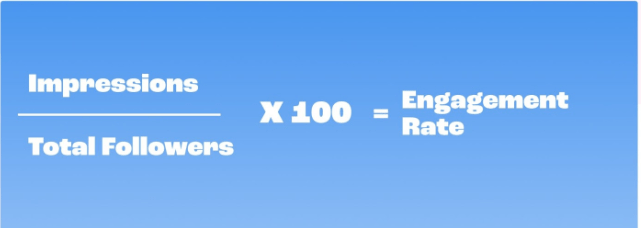
Google calculates the engagement rate using this formula:
The engagement rate is calculated as (Number of Engaged Sessions / Total Number of Sessions) * 100.
This means it takes the number of engaged sessions and divides it by the overall number of sessions (whether engaged or not).
For example, if a page has 400 engaged sessions out of a total of 1100 sessions, the engagement rate would be:
(400 ÷ 1100) × 100 = 36.36%
So, the engagement rate is 36.36%.
When analyzing your engagement rate, consider how this metric can assist in the following areas:
Engagement rate is influenced by triggered events (conversions), providing insights that can help identify opportunities to boost engagement. Generally, higher engagement rates lead to more conversions overall.
For conversion rate optimizers (CROs), engagement rate is a valuable metric. It offers a detailed understanding of site interaction, allowing for deeper analysis through tools like tag manager and conversion tracking.
Are visitors from TikTok or email marketing engaging more with your site compared to those from search engines? This information can help create user profiles and optimize user journeys based on which sources drive the best engagement.
Measuring user satisfaction through engagement rates is crucial for improving marketing strategies. This metric provides insights to optimize campaigns, refine messaging, and align with user preferences. By consistently monitoring these rates, you can improve user experience, build loyalty, and increase conversions.
Additionally, engagement rates highlight areas needing improvement. For instance, if email campaigns have only a 20% engagement rate compared to 40% from social and SEO campaigns, you might choose to either shift focus away from email or apply successful tactics from social and SEO campaigns to improve email performance.
When it comes to engagement rates, here’s a simple guideline to help you understand where you stand:
This is quite the opposite of bounce rate metrics. If your bounce rate were at 1%, you’d be thrilled! While a high bounce rate typically signals trouble, a high engagement rate is something to celebrate. Engagement rate and bounce rate track different user behaviors, so aiming for a high engagement rate is generally a positive goal!
To locate your Engagement Rate in Google Analytics 4, follow these steps:
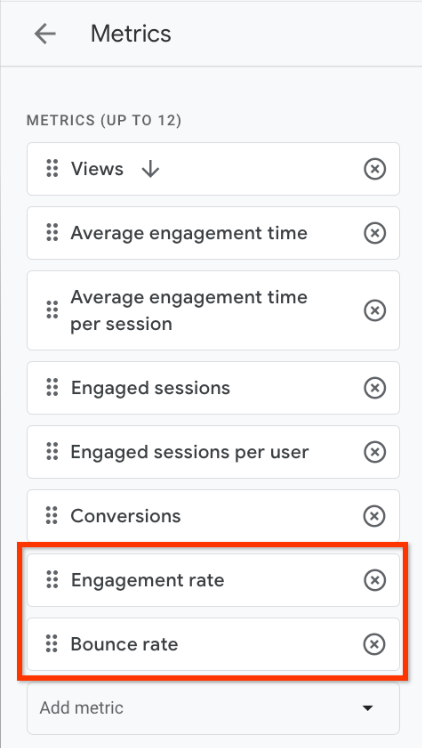
Regarding bounce rates, while they may not be immediately visible in GA4, they are still accessible. We recommend keeping an eye on them to gauge your website’s performance over time.
GA4 allows for segmenting user data to gain deeper insights into engagement rates. You can segment by various factors like demographics, traffic source, device type, and more. This granular analysis helps identify specific user groups with lower engagement and allows you to tailor strategies to improve their experience.
By understanding these additional aspects of engagement rate, you can leverage this metric to optimize your website and content strategy for a more engaged and loyal user base.
If you require assistance in setting up your Analytics 4 account to track the data that matters most to you, reach out to us. At Tomatotree Digital, based in Kerala, we specialize in SEO and prioritize data transparency in all our services. We look forward to hearing from you!
This page directly from Google Analytics explains engagement rate and bounce rate and their differences.
This blog post by Portent, a well-respected digital marketing agency, dives into Engagement Rate in GA4, including average engagement rates by industry.
This article by Fathom Analytics offers a clear explanation of Engagement Rate and how it works in GA4.
Take charge of your digital growth with TomatoTree Digital, the leading SEO company in Kerala. Tailored strategies, measurable results—contact us today!
Never settle for anything less than the best! Hire the top SEO experts from the Best SEO Company in Kerala and benefit from the customized Search Engine Optimization strategies designed exclusively for your brand.
India
United Kingdom
Newsletter
Never settle for anything less than the best!
Other Links
WhatsApp us